Rocklands is the winter Font of the southern hemisphere — 5,000+ world-class problems on Cederberg Table Mountain Sandstone. But the trip is a long way from anywhere, and the friction window is famously narrow. When should you actually book?
We ran our Rocklands-specific climbingforecast.co.uk model with 30 years of NASA POWER climate data (MERRA-2 reanalysis, 1991–2020) sampled at the Pakhuis Pass coordinates. Here's what the data says, and — importantly — where the data alone will mislead you.
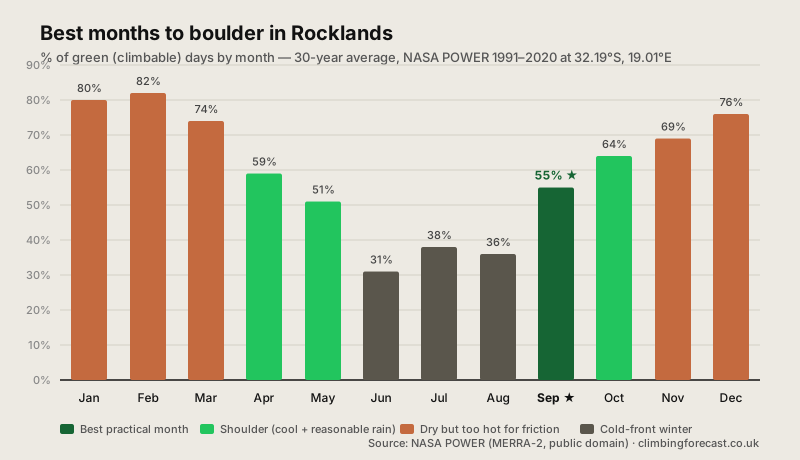
When is the best time to climb in Rocklands?
The practical sweet spot: September. 55% chance of a climbable day, and by then the winter cold-front rain window has largely closed but the air is still cold enough for the friction Rocklands is famous for. October (64%) is drier but noticeably warmer; April (59%) is the mirror-image shoulder at the other end. Locals and repeat visitors book September and April deliberately, and everyone else compromises inside the classic May–September Rocklands "high season" and accepts the cold-front days as the tax on the friction they are there for.
When the data will mislead you: December, January and February. The chart above shows summer as the "best" months — 76–82% green days. That is completely correct as a statement about rain, and completely wrong as advice. Mean daily highs at the boulders sit at 28–33°C in summer and Table Mountain Sandstone friction collapses when the rock is warm. Nobody climbs Rocklands hard in January. Skip summer.
Month-by-month conditions
| Month | Green Days | Amber Days | Red Days | % Green | Green + Amber |
|---|---|---|---|---|---|
| Jan | 24.9 | 4.2 | 1.9 | 80% | 94% |
| Feb | 23.1 | 3.4 | 1.5 | 82% | 95% |
| Mar | 23.1 | 5.1 | 2.8 | 74% | 91% |
| Apr | 17.8 | 7.5 | 4.7 | 59% | 84% |
| May | 15.9 | 8.9 | 6.2 | 51% | 80% |
| Jun | 9.2 | 11.1 | 9.7 | 31% | 68% |
| Jul | 11.8 | 10.7 | 8.5 | 38% | 73% |
| Aug | 11.1 | 11.1 | 8.8 | 36% | 72% |
| Sep ★ | 16.4 | 8.3 | 5.3 | 55% | 82% |
| Oct | 19.8 | 7.1 | 4.1 | 64% | 87% |
| Nov | 20.6 | 6.2 | 3.1 | 69% | 90% |
| Dec | 23.5 | 5.2 | 2.3 | 76% | 92% |
Based on 30 simulated years using NASA POWER climate reanalysis (MERRA-2, 1991–2020) sampled at 32.19°S, 19.01°E — the Pakhuis Pass grid cell — with a temperature altitude correction and Cederberg orographic rainfall enhancement applied per sector. Cross-checked against SAWS long-term Clanwilliam averages (~370 mm/yr) and the documented Algeria Forestry Station gradient (~800 mm/yr at 700 m in the Cederberg Wilderness). Averaged across the ten Rocklands sectors. Factors in rain, wind, humidity and the Table Mountain Sandstone "never climb damp" rule enforced by our drying model (24 h RED, 72 h AMBER after any rain).
Should you climb Rocklands in summer or winter?
Summer looks great in the data — do not trust it. December through February score 76–82% green because they are the driest months on the calendar. But typical afternoons at 730 m sit at 30°C+ and the boulders bake in the Cederberg sun. Friction dies, sweat runs, and the practical sending window collapses to a few pre-dawn hours. The model does not know about heat-death of friction on hard sandstone — you do. Every Rocklands regular skips summer.
Winter is the "peak" for a reason, cold fronts and all. The Cederberg winter (May–September, especially June–August) is the only window when Table Mountain Sandstone is genuinely cold. Air temperatures at the boulders sit at 15–20°C in the middle of the day, mornings are crisp, and the rock has the friction hard grades require. The trade-off is real — 5–10 days a month will be lost to cold fronts sweeping in from the Atlantic — but the sending days between them are what people fly here for. Build a 3–4 week block so you can wait out storms.
Watch the Plateau. Rocklands sits either side of the ~600 m step up onto the Pakhuis plateau. Cold fronts hit the plateau first and hardest — cloud can be sitting on the Amphitheatre while the Roadside below is in sunshine. If the pass is dry but the Plateau boulders read damp, that is genuinely happening and worth respecting.
Which sector for which conditions?
All ten Rocklands sectors share the regional weather but split into two microclimate clusters — the ~700 m Pakhuis Pass main area, and the ~950 m Plateau above it:
- Roadside — lowest-altitude, open aspect, moderate exposure. Fastest-drying and warmest on cool days; comes into condition first after a Cederberg cold front.
- Campground (Traveller's Rest) — same altitude as Roadside, walk-off-the-verandah access, warm-up and rest-day venue for most trips.
- De Pakhuys — the heart of Rocklands and the anchor for most trips. Mid-altitude, moderate exposure, home to Nutsa, Splash of Red, Sky.
- Fields of Joy — next door to De Pakhuys, densest concentration of quality bouldering at Rocklands.
- Riverside — streamside, slightly higher seepage; add a day after rain compared with the pass proper.
- The Plateau — 1,050 m tableland sector, coolest and windiest, gets cloud and rain first. When it is dry, some of the best rock in Rocklands.
- The Amphitheatre — south-facing 950 m bowl of world-class hard problems (Golden Shadow, Black Shadow). Cool even in warm spells, cold in winter.
- Sassies — short walk-in, mid-altitude compromise between Plateau and Pass.
- 8 Day Rain — remote sector named for the 1998 storm that trapped climbers in camp. Slightly slower to dry.
- Tea Garden — quieter plateau option with a strong hit-rate of V4–V8 classics.
The forecast at climbingforecast.co.uk runs the drying model per-sector, so once you're on the ground you can see which one is actually in condition rather than guessing.
Practical Peak
September delivers the best combined odds — 55% green days plus air cold enough for Table Mountain Sandstone friction. April is the mirror shoulder if you want to start the season instead of finishing it.
Cold-Front Winter
June through August drop to 31–38% green days as Atlantic cold fronts sweep the Cederberg. This is still the friction peak that most Rocklands regulars book — but plan a long trip so storms can be sat out.
The Summer Trap
December–February score 76–82% green on rain alone but boulders bake at 30°C+. Friction is dead and the sending window collapses to a few pre-dawn hours. Genuinely: skip summer.
How we calculated this — and why the data is legal to publish
We pulled the full 1991–2020 daily weather record for the Rocklands coordinates from NASA POWER — a U.S. Federal Government product built on the MERRA-2 reanalysis and constrained by satellite and station observations. That gave us 10,957 days of daily mean, max and min temperature, corrected precipitation, relative humidity, wind speed and cloud cover at 32.19°S, 19.01°E (grid-cell elevation 303 m). We aggregated to monthly climate normals, applied a standard 6.5 °C / 1000 m lapse-rate correction to reach each Rocklands sector's actual altitude (620–1050 m), and applied a Cederberg orographic rainfall enhancement (from ~370 mm/yr at Clanwilliam to ~800 mm/yr at Algeria Forestry Station in the wilderness — a documented gradient of ~+60% rainfall per 1000 m of orographic lift).
From each month's normals we drew 30 synthetic years of daily weather (Gaussian temperature draws around the monthly mean, gamma-distributed rain amounts, log-normal wind, humidity conditional on rain state) and ran every simulated day through our drying model for all ten Rocklands sectors. Each day gets a GREEN, AMBER or RED status based on rain, drying time, wind and the Table Mountain Sandstone "never climb damp" rule (24 h RED, 72 h AMBER after any rain). The table above is the average across 30 years and ten sectors — 300 sector-years of simulated conditions.
We use NASA POWER rather than Open-Meteo or the SAWS station archive on purpose. NASA POWER is public-domain U.S. Government output with no restrictions on commercial use — you are free to republish figures derived from it, which is why it is safe for us to build a public article around. SAWS station data falls under WMO Resolution 40 which places international commercial-use restrictions on member-state exports, so we use SAWS-published headline averages for Clanwilliam and the Cederberg Conservancy rainfall gradient as sanity checks, not as the primary source. Open-Meteo is reserved for our internal accuracy verification.
The same methodology powers our Albarracín, Fontainebleau, Peak District and Spain regional data pieces. It is not a substitute for checking the actual forecast the week you're going — but it is the honest answer to "when should I book Rocklands?"
Good luck and enjoy the climbing!