The Red River Gorge in eastern Kentucky is one of the best sport climbing areas in the United States. Dozens of crags of hard, pocketed Corbin sandstone line the ridges of the Daniel Boone National Forest, about an hour east of Lexington, with thousands of routes from steep 5.10 jug hauls to the overhanging test pieces of the Motherlode. Everyone says autumn is the season, but how much better is it than spring, how wet does the Red really get, and is summer worth it? We used 30 years of weather data to find out.
We replayed 30 years (1995–2024) of real daily observations from the NOAA weather station at Jackson, Kentucky, about 35 km (22 miles) south-east of the crags, through the climbingforecast drying model. We ran it for four of the Gorge's main areas: Muir Valley, the Motherlode, the Pendergrass-Murray Recreational Preserve (PMRP) and Miller Fork. They came out within a few points of each other every month, so the numbers below are for the Gorge as a whole. The model's dry-heat check lets us separate the three things that stop you climbing here: rain, summer heat and, now and then, winter snow.
When is the best time to climb in the Red River Gorge?
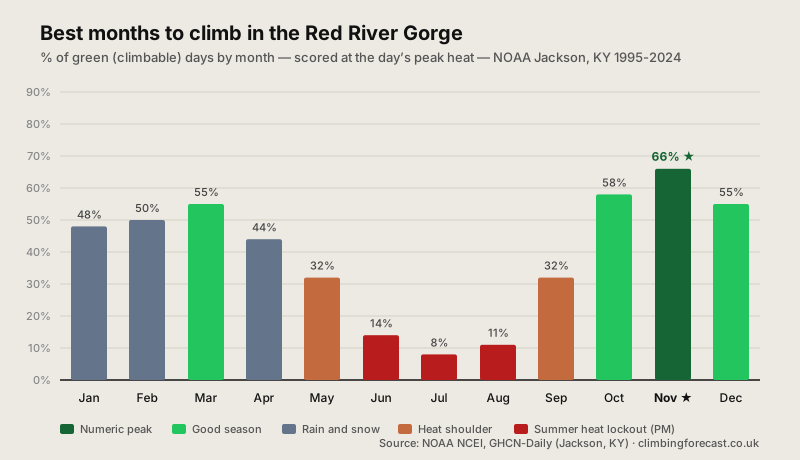
Autumn, and November is best. November leads at 66% green days for a full afternoon session, and October is second at 58%. "Rocktober" has its reputation for a reason: autumn is the driest season in the Gorge, with about 83 mm (3.3 in) of rain a month on seven or eight wet days, against ten or eleven wet days in every other season. The heat is gone too. October highs average about 21°C (70°F) and November about 15°C (59°F), which is ideal for friction on the Red's pockets and crimps.
November is also the most dependable month. It scored 70% or better in 10 of the 30 years, and 93% in 2009. October reached 70% in six years. Both still vary: the worst November was 37% (2024) and the worst October 32% (2018). If you're flying in for a week, keep a spare day or two in the plan.
Spring comes second. March (55%) is as good as December, but April drops to 44% and May to 32%. Spring is wetter than autumn, and by late April the afternoons are getting warm.
Red River Gorge climbing conditions month by month
| Month | Green Days | Amber Days | Red Days | % Green | Green + Amber |
|---|---|---|---|---|---|
| Jan | 15.0 | 1.5 | 14.5 | 48% | 53% |
| Feb | 14.1 | 1.4 | 12.7 | 50% | 55% |
| Mar | 17.2 | 1.8 | 12.0 | 55% | 61% |
| Apr | 13.3 | 5.4 | 11.3 | 44% | 62% |
| May | 9.9 | 9.3 | 11.8 | 32% | 62% |
| Jun | 4.2 | 14.6 | 11.2 | 14% | 63% |
| Jul | 2.4 | 16.5 | 12.1 | 8% | 61% |
| Aug | 3.3 | 17.6 | 10.1 | 11% | 67% |
| Sep | 9.6 | 12.8 | 7.7 | 32% | 74% |
| Oct | 18.0 | 4.7 | 8.3 | 58% | 73% |
| Nov ★ | 19.8 | 1.3 | 9.0 | 66% | 70% |
| Dec | 17.1 | 0.7 | 13.1 | 55% | 58% |
Based on 30 years (1995–2024) of real daily observations from the NOAA station at Jackson, Kentucky, adjusted to crag height and scored at each day's peak heat. Averaged across Muir Valley, the Motherlode, PMRP and Miller Fork. Factors in rain, drying time, wind, seepage, snow and the dry-heat rule enforced by our drying model. Source: NOAA National Centers for Environmental Information, GHCN-Daily.
How much does it rain in the Red River Gorge? All year round
The data averages 1,304 mm (51 in) of rain a year, on about 119 days with 1 mm or more. That's more than twice as much as a Spanish venue like Siurana. Unlike in Spain, there's no dry season: summer brings 29% of the year's rain, spring 27%, winter 25% and autumn only 19%. July (140 mm, 5.5 in) and May (132 mm, 5.2 in) are the wettest months, mostly from thunderstorms. September, October and November are the driest, at about 83 mm (3.3 in) each.
Rain is what costs you days in every month from October to April. On average, rain and the drying time after it make 8 to 11 days a month red. The wettest day in 30 years was 3 April 2015, with 109 mm (4.3 in). The wettest month was July 2022, when the eastern Kentucky floods dropped 378 mm (14.9 in) on Jackson, including 104 mm (4.1 in) on 27 July alone.
Corbin sandstone is hard and well cemented, and it dries faster than soft sandstone. But it's still sandstone, and wet holds are weaker and can snap. Our model waits about 36 hours after rain before rating the rock green, and longer after heavy rain or on seepy walls. Some of the steepest caves, such as parts of the Motherlode, stay dry in a passing shower. The model doesn't know that, so on showery days the real picture in the big overhangs is a little better than our numbers.
Can you climb in the Red River Gorge in summer? Only at dawn
Scored at the day's peak heat, June drops to 14% green, July to 8% and August to 11%. Highs average about 30°C (86°F) in July and August at crag height, and pass the model's 27°C (81°F) heat line on about 25 days a month. About six or seven days a month reach 32°C (90°F). The hottest day in the record, 29 June 2012, reached about 41°C (106°F). Kentucky's summer is also humid, with daily humidity averaging 71–76% from June to September, so the rock feels greasy even when it's dry.
Scored at the day's low instead, as a proxy for a first-light start, the summer months jump to 61% (June and July) and 69% (August). September at dawn is the best score of the year, at 75%. Summer is a heat problem, not a rain problem. Climb early, head for the north-facing walls and the shady bunkers, and be off the sunny walls by late morning. May and September are shoulder months: both score 32% in the afternoon and about 60–75% at dawn.
Can you climb in the Red River Gorge in winter? On the right days
Winter is colder than many climbers expect. January highs average about 7.5°C (46°F) and lows about −1.5°C (29°F), with around 18 frosty nights in January, 14 in February and 14 in December. In the valley bottoms, where cold air pools overnight, mornings can be colder still. The coldest night in the record, 4 February 1996, dropped to about −21°C (−6°F).
Snow costs a few days each winter. On average there's snow on the ground on about six days in January, five in February and three in December. The biggest snowfall in the record was the January 2016 blizzard, which left 43 cm (17 in) on the ground. The snow usually melts within a few days.
Even so, winter afternoons still score 48–55% green, not far off spring. There's nothing to gain by starting early in winter: scored at the day's low, December to February barely move. Wait for the sun, pick a dry, windless day, and head for south-facing walls such as Roadside or Bob Marley Crag at PMRP. At the Motherlode, the Buckeye Buttress and Warm-Up Wall catch the morning sun. Cold, dry days give some of the best friction of the year.
Autumn Wins
November leads at 66% green days and October is next at 58%. Autumn is the driest season, and the heat is gone. This is when to book.
Rain All Year
The Gorge gets about 1,300 mm (51 in) of rain a year on about 120 wet days, with no dry season. Keep a spare day in the plan, whatever the month.
Summer Heat
June to August drop to 8–14% green in the afternoon. If you go in summer, start at first light on the shady, north-facing walls.
How we calculated this
We ran 30 years of real daily weather (1995–2024) from the NOAA station at Jackson, Kentucky (Julian Carroll Airport, 445 m) through the drying model behind the live Motherlode forecast. It's the closest station with a full, long record of temperature, rain, snow depth, wind and humidity. As a check, the Clay City station in the Red River valley, which only records rain, averages 1,244 mm a year over the same period, within 5% of Jackson.
The crags sit at 233–346 m, lower than the station, so we adjusted temperatures up by 0.6–1.4°C (1–2.5°F) using the standard lapse rate. Daily humidity was recorded from 2006. For 1995–2005 we used the station's own monthly averages from 2006–2024. Each day is rated GREEN, AMBER or RED on recent rain, drying time, wind, snow on the ground and heat, scored once at the day's high and once at its low. The model doesn't mark days down for cold, so the winter temperatures above come from the weather record, not the ratings.
Data retrieved 30 September 2026 from NOAA NCEI's GHCN-Daily dataset (station USW00003889). Source: NOAA National Centers for Environmental Information.
It won't replace checking the forecast the week you go, but it's an honest answer to "when should I book?". Before you go, check the live Motherlode, Muir Valley, PMRP and Miller Fork forecasts. For more US climbing, see our Hueco Tanks, Bishop and Joe's Valley articles.
Good luck and enjoy the climbing!