Bishop is the Eastern Sierra's bouldering capital — the Buttermilks' towering highball quartz-monzonite, the Happy and Sad Boulders' pocketed volcanic tuff on the Volcanic Tableland, all sitting in one of the driest rain shadows in the American West. Guidebooks call it a year-round destination almost in passing. We wanted to know whether the weather actually backs that up — including the part guidebooks usually just gesture at: the heat.
We replayed 30 years of real daily observations from the NOAA NCEI Bishop Airport station through the climbingforecast drying model, run separately for the Buttermilks and the Happy/Sad Boulders. This piece also uses the model's dry-heat climbability check, so — unlike a rain-only replay — it can actually tell you when Bishop's famous desert heat crosses the line into "too hot to climb well." Here's what the data says.
When is the best time to boulder in Bishop?
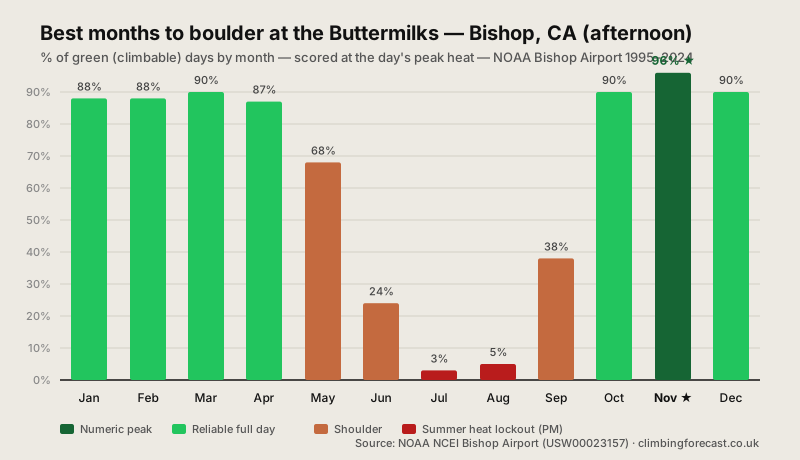
For a full day out, the numeric peak is November — 96% green days at both venues. October through April all stay reliable, 87% or higher at the Buttermilks and 91% or higher at the Happy/Sad Boulders. That's the same rain-shadow story we'd expect from Bishop's ~130mm-a-year climate and fast-draining rock.
But summer afternoons are a genuine collapse, not a comfort footnote. Scored at each day's peak heat, June through September fall off a cliff: the Buttermilks drop to 24% (Jun), 3% (Jul) and 5% (Aug); the lower, hotter Happy/Sad Boulders drop to 8%, 0% and 1% over the same months, with real RED "too hot to climb well" days appearing for the first time anywhere in this dataset. That's the site's dry-heat climbability rule doing exactly what it's meant to — Owens Valley afternoons in July average 37.4°C, well past the 38°C line where most climbers write the day off.
Buttermilks: month-by-month conditions (afternoon)
| Month | Green Days | Amber Days | Red Days | % Green | Green + Amber |
|---|---|---|---|---|---|
| Jan | 27.3 | 1.7 | 2.0 | 88% | 94% |
| Feb | 24.9 | 2.2 | 1.2 | 88% | 96% |
| Mar | 27.8 | 2.6 | 0.6 | 90% | 98% |
| Apr | 26.2 | 3.6 | 0.2 | 87% | 99% |
| May | 21.2 | 9.8 | 0.0 | 68% | 100% |
| Jun | 7.3 | 22.7 | 0.0 | 24% | 100% |
| Jul | 0.8 | 29.7 | 0.5 | 3% | 98% |
| Aug | 1.5 | 29.5 | 0.0 | 5% | 100% |
| Sep | 11.3 | 18.7 | 0.0 | 38% | 100% |
| Oct | 27.8 | 3.1 | 0.1 | 90% | 100% |
| Nov ★ | 28.8 | 0.9 | 0.3 | 96% | 99% |
| Dec | 27.8 | 1.7 | 1.5 | 90% | 95% |
Based on 30 years of real daily observations (1995–2024) from the NOAA NCEI Bishop Airport station (1,253m, 20km away), lapse-corrected to the Buttermilks' altitude (1,948m) and replayed through the climbingforecast drying model. Each day is scored at its recorded maximum temperature, so this table represents an afternoon check — see the early-morning comparison below.
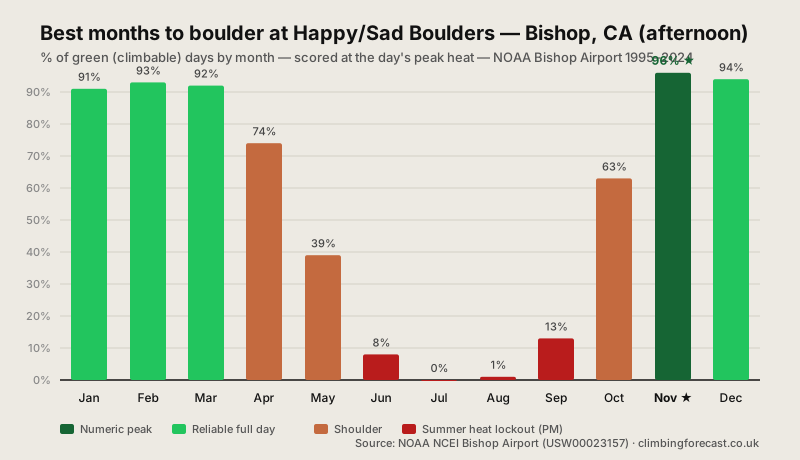
Happy/Sad Boulders: month-by-month conditions (afternoon)
| Month | Green Days | Amber Days | Red Days | % Green | Green + Amber |
|---|---|---|---|---|---|
| Jan | 28.3 | 1.2 | 1.5 | 91% | 95% |
| Feb | 26.3 | 1.0 | 0.9 | 93% | 97% |
| Mar | 28.6 | 2.0 | 0.4 | 92% | 99% |
| Apr | 22.1 | 7.8 | 0.1 | 74% | 100% |
| May | 12.2 | 18.7 | 0.1 | 39% | 100% |
| Jun | 2.4 | 23.5 | 4.1 | 8% | 86% |
| Jul | 0.1 | 17.6 | 13.3 | 0% | 57% |
| Aug | 0.2 | 24.2 | 6.6 | 1% | 79% |
| Sep | 3.8 | 25.4 | 0.8 | 13% | 97% |
| Oct | 19.6 | 11.3 | 0.0 | 63% | 100% |
| Nov ★ | 28.9 | 0.8 | 0.3 | 96% | 99% |
| Dec | 29.0 | 1.0 | 1.0 | 94% | 97% |
Based on 30 years of real daily observations (1995–2024) from the NOAA NCEI Bishop Airport station (1,253m, 8km away, near-identical altitude — used directly), replayed through the climbingforecast drying model and scored at each day's maximum temperature. Happy Boulders and Sad Boulders share drying-model parameters, so the two-sector average is a clean "Volcanic Tablelands" number.
Beat the heat: early starts change everything
Bishop's desert climate cuts both ways — the same aridity that keeps the rock bone-dry also produces a huge day/night temperature swing. July at Bishop Airport averages a 37.4°C high and a 14.0°C low. The tables above score every day at its afternoon maximum; re-running the identical 30 years scored at each day's overnight low instead — a proxy for a first-light start — gives a completely different summer:
| Month | Buttermilks — afternoon | Buttermilks — early morning | Happy/Sad — afternoon | Happy/Sad — early morning |
|---|---|---|---|---|
| Jun | 24% | 97% | 8% | 98% |
| Jul | 3% | 99% | 0% | 100% |
| Aug | 5% | 99% | 1% | 100% |
| Sep | 38% | 98% | 13% | 99% |
Same 30-year record, same zones, same drying model — the only change is which recorded daily temperature represents "now." This isn't a loophole in the model; it's the same logic Bishop locals already use, climbing dawn or dusk through summer and writing off the afternoon.
Reliable Full-Day Season: Oct–Apr
November is the numeric peak (96% at both venues) and October through April stay reliable (87%+). No rain-damage restriction on quartz-monzonite or welded tuff, so this is genuinely a full-day, any-time-of-day season.
Altitude Cuts Both Ways
The higher, cooler Buttermilks (1,948m) beat the lower Happy/Sad Boulders (1,284m) in summer heat (Jun 24% vs 8%) but lose to them in winter cold-snap snow (Jan 88% vs 91%). Pick your venue by season, not just by classic status.
Summer Afternoons Are a Real Write-Off
June–September afternoons now score as low as 0% green under the model's dry-heat rule — not a comfort footnote, a genuine climbability collapse. The fix is free: the same months score 97–100% at first light.
How we calculated this
30 years of real daily observations (1995–2024) from the NOAA NCEI Bishop Airport station (USW00023157, 1,253m), lapse-corrected (−6.5°C/km) for the Buttermilks' 695m altitude gap; the Happy/Sad Boulders sit within 31m of the station's own altitude, so no correction was needed. Real daily temperature, precipitation and snow depth for the full 30 years; real daily humidity from 2006, with a station-derived monthly climatology filling 1995–2005. Snow depth converts to snow-water-equivalent and feeds the drying model's snow accumulator, same as our Squamish piece. The published tables score each day at its recorded maximum temperature through the model's rain/snow/humidity logic and its dry-heat climbability check (AMBER ≥27°C, RED ≥38°C); the early-morning comparison reruns the identical days scored at each day's recorded minimum instead. Each day gets a GREEN, AMBER or RED status per zone; the tables are the 30-year average.
The same methodology powers our Squamish, Chironico, Cresciano, Magic Wood, Val di Mello, Rocklands, Albarracín and Fontainebleau data pieces. It's not a substitute for checking the actual forecast the week you're going — but it's the honest answer to "when should I book?"
Good luck and enjoy the climbing!