Chironico is one of the largest bouldering venues in Europe — over 2,100 problems across 37 sectors on the wooded hillside above the village in Valle Leventina, from Big Paw (Dave Graham's 2008 sit-start to Boogalagga, 8C) down to hundreds of moderates. It has a long-standing reputation as a cold-weather venue for the hardest problems. When should you actually go?
We replayed 30 years of real daily observations — weather and, where it exists, real snow depth — from the MeteoSwiss OGD Piotta reference station through the climbingforecast drying model. Here's what the data says.
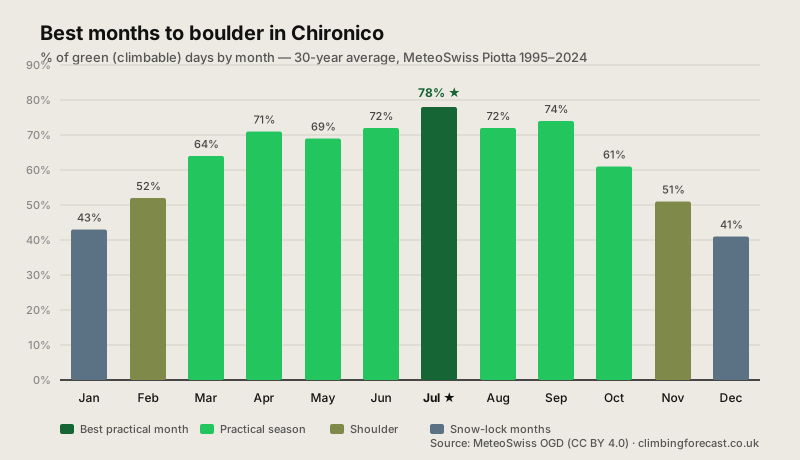
When is the best time to boulder in Chironico?
The numeric peak: July, at 78%. June, August and September follow closely at 72–74%, and the practical season is unusually wide either side of that — March (64%) through October (61%) never drops below 61%. If the only question is "what gives me the best odds of finding dry rock," the answer is summer through early autumn, not the depths of winter.
But Chironico's winter reputation is answering a different question. Serious projectors go in winter for cold, dense air and the friction boost it gives the hardest slopers — that's real, and separate from what this model measures. Our drying model scores whether the rock is dry, not how good the friction is on a dry day. At 900m, winter also brings a genuine, moderate snow lock: December (41%) and January (43%) are the two weakest months in the whole year, backed by real observed snow-depth data at the reference station rather than a guess. Both things can be true — the days that are clear in December and January are excellent for hard sends, and there are fewer of those clear days than in any other month.
Month-by-month conditions
| Month | Green Days | Amber Days | Red Days | % Green | Green + Amber |
|---|---|---|---|---|---|
| Jan | 13.5 | 4.0 | 13.5 | 43% | 56% |
| Feb | 14.7 | 3.4 | 10.2 | 52% | 64% |
| Mar | 19.8 | 6.1 | 5.1 | 64% | 84% |
| Apr | 21.4 | 8.2 | 0.4 | 71% | 99% |
| May | 21.3 | 9.2 | 0.5 | 69% | 98% |
| Jun | 21.7 | 8.3 | 0.0 | 72% | 100% |
| Jul ★ | 24.0 | 6.9 | 0.0 | 78% | 100% |
| Aug | 22.2 | 8.7 | 0.1 | 72% | 100% |
| Sep | 22.3 | 7.6 | 0.1 | 74% | 100% |
| Oct | 18.9 | 11.5 | 0.6 | 61% | 98% |
| Nov | 15.3 | 11.6 | 3.1 | 51% | 90% |
| Dec | 12.8 | 5.8 | 12.4 | 41% | 60% |
Based on 30 years of real daily observations (1995–2024) from the MeteoSwiss OGD Piotta station (990m, 13.7km away in the same Valle Leventina), lapse-corrected to Chironico's altitude (900m) and replayed through the climbingforecast drying model, with real observed snow depth injected wherever the station's sensor has a reading.
A moderate snow lock, not a closure
Chironico sits in the middle of our three Ticino-area gneiss pieces. Cresciano, 500m lower down the same region, barely sees snow at all (Dec 52%, Jan 64%) and is the honest winter destination if Chironico is buried. Val di Mello, at a similar altitude to Chironico but in a different Alpine valley system, is genuinely closed in winter (Jan 27%, Feb 36%) under real observed snowpack. Chironico's December (41%) and January (43%) sit between the two — a real, moderate dip rather than either extreme — which matches its Insubric-influenced climate: cold enough at 900m for snow to settle and stick around, but not shut down the way a deeper Alpine valley is.
How we calculated this
We took every day from 1995 to 2024 at the MeteoSwiss OGD Piotta station (990m, 13.7km away in the same valley) and ran each day through our drying model for the Chironico zone. Piotta has a complete daily record for temperature, rain, humidity and wind across the full window, and cross-validates on monthly rain against Airolo further up the valley (r = 0.949) and Biasca at the valley mouth (r = 0.892). Piotta's own automatic snow-depth sensor sits in the same station file — complete from 2013, partial back to 2009 — so we inject its real observed depth (converted to snow-water-equivalent) directly into the drying model's snow accumulator on every day it exists, and fall back to the same temperature-partitioned snowfall heuristic used in our Cresciano piece for 1995–2008, where no sensor reading exists. Each day gets a GREEN, AMBER or RED status; the chart above is the 30-year average % GREEN per calendar month.
The same methodology (real observed weather run through the drying model) powers our Cresciano, Magic Wood, Val di Mello, Rocklands, Squamish, Albarracín and Fontainebleau data pieces. It's not a substitute for checking the actual forecast the week you're going — but it's the honest answer to "when should I book?"
Good luck and enjoy the climbing!